

ONLINE DATA VISUALIZATION
Infographics, data, and content can easily thrive online.
We are visual beings. We’re blessed with senses like sight, hearing, taste, touch, and feeling. And when it comes to the visual part of the senses we can experience an amazing array of experiences that leverage color, text, typefaces, design, pictures, illustrations, that all have a profound effect on the visual experience. This experience can be customized and leveraged specifically to present a very precise message. It’s what we use for advertising, marketing, and design. As creative types, we create an experience for our viewers.
A variety of choices
Specifically, when it comes to data visualization— aka infographics, we are starting with data—content. And then we portray or display that data in a certain way for a certain experience. Let’s start with a basic document—kind of like what you are reading now. It can be simple text as a simple and hopefully informative read, or can be re-assembled or designed in such a way that it’s more graphically engaging and thus making it more fun to read. A good infographic can make the content exciting, interesting, and tends to lead you somehwere—be it more information, or other infographics. IF done well…
A few options of online visual data visualization
Infographic
Interactive online infographic
Min.igraphics
iView
iBooklet
Animated infographic
ePub
Slide-docs
Just as there are thousands of design possibilities with infographics, that can just as easily be applied to online versions of that same data. With tech the way it is today—and obviously growing, we can visualize graphics online in numerous ways. And not just on the computer screen. We can implement sound “responsive” content that looks just as great on a smart phone or tablet.
Online infographics as one option

We can easily create or “recycle” content into multiple deliverables. For example, an infographic can be re-rendered into an animated version with sound and motion, or as a responsive online version.
With numerous software enhancements and availability, it’s easier than even for creators to develop amazing digital content for online users. We can develop not only robust and interactive digital content on desktop—an interactive pdf document for example, but we can create the content to be viewed online—be it through hyperlinks, on websites, or platforms like YouTube, Vimeo, and others—or directly emailed, texted, or driven through social media, another huge trend.
If you work with the right creative team or professional, we can provide not just the creation—but provide other ideas and examples of presenting your content in new and exciting ways. It’s important to stay on top of what’s happening in the creative space to help keep you on the interesting and exciting creative front, trying new and fresh things—but also to be able to provide ideas to colleagues and creative clients as well.
There are numerous opportunities for developing and delivering engaging, and meaningful creative content. And online visualization, or “online infographics” is just one of them.
Here are some ‘online infographic’ examples we’ve done. A variety of possibilities… And be sure to explore them on mobile!

Responsive Online Infographic
Cloud Communications Delivers Better Business Outcomes
Total online responsive infographic, Sponsored by Vonage
(has analytics tracking on it as well)

Interactive infographic
The Shift to the Third Platform
Online hosted infographic with share, pdf download, and other features… (see tools at bottom)
This is an example of an infographic that can EASILY be created as an online version (additionally)
Vector-based, responsive animated infographic
Data Dilemma
Responsive (on any device) vector-based, ANIMATED html infographic

Min.igraphic
Small, simple infographics. Responsive, and online only—3 samples…
http://www.weblivenow.com/samples/minigraphics/1/index.html
http://www.weblivenow.com/samples/minigraphics/2/index.html
http://www.weblivenow.com/samples/minigraphics/3/index.html

iview
Fully-responsive, modern online content applications. They provide a variety of design and style options as well as interactivity and functionality to present any content in a highly engaging, fun, and interactive format with stunning colors, fonts, and graphics.
http://www.weblivenow.com/samples/iView/1/index.html http://www.weblivenow.com/samples/iView/2/index.html http://www.weblivenow.com/samples/iView/3/index.html

ibooklet
An innovative online document application. Uses a variety of website basics as well as modern online technology to create a nifty online content experience.
http://www.weblivenow.com/samples/iBooklet/index.html
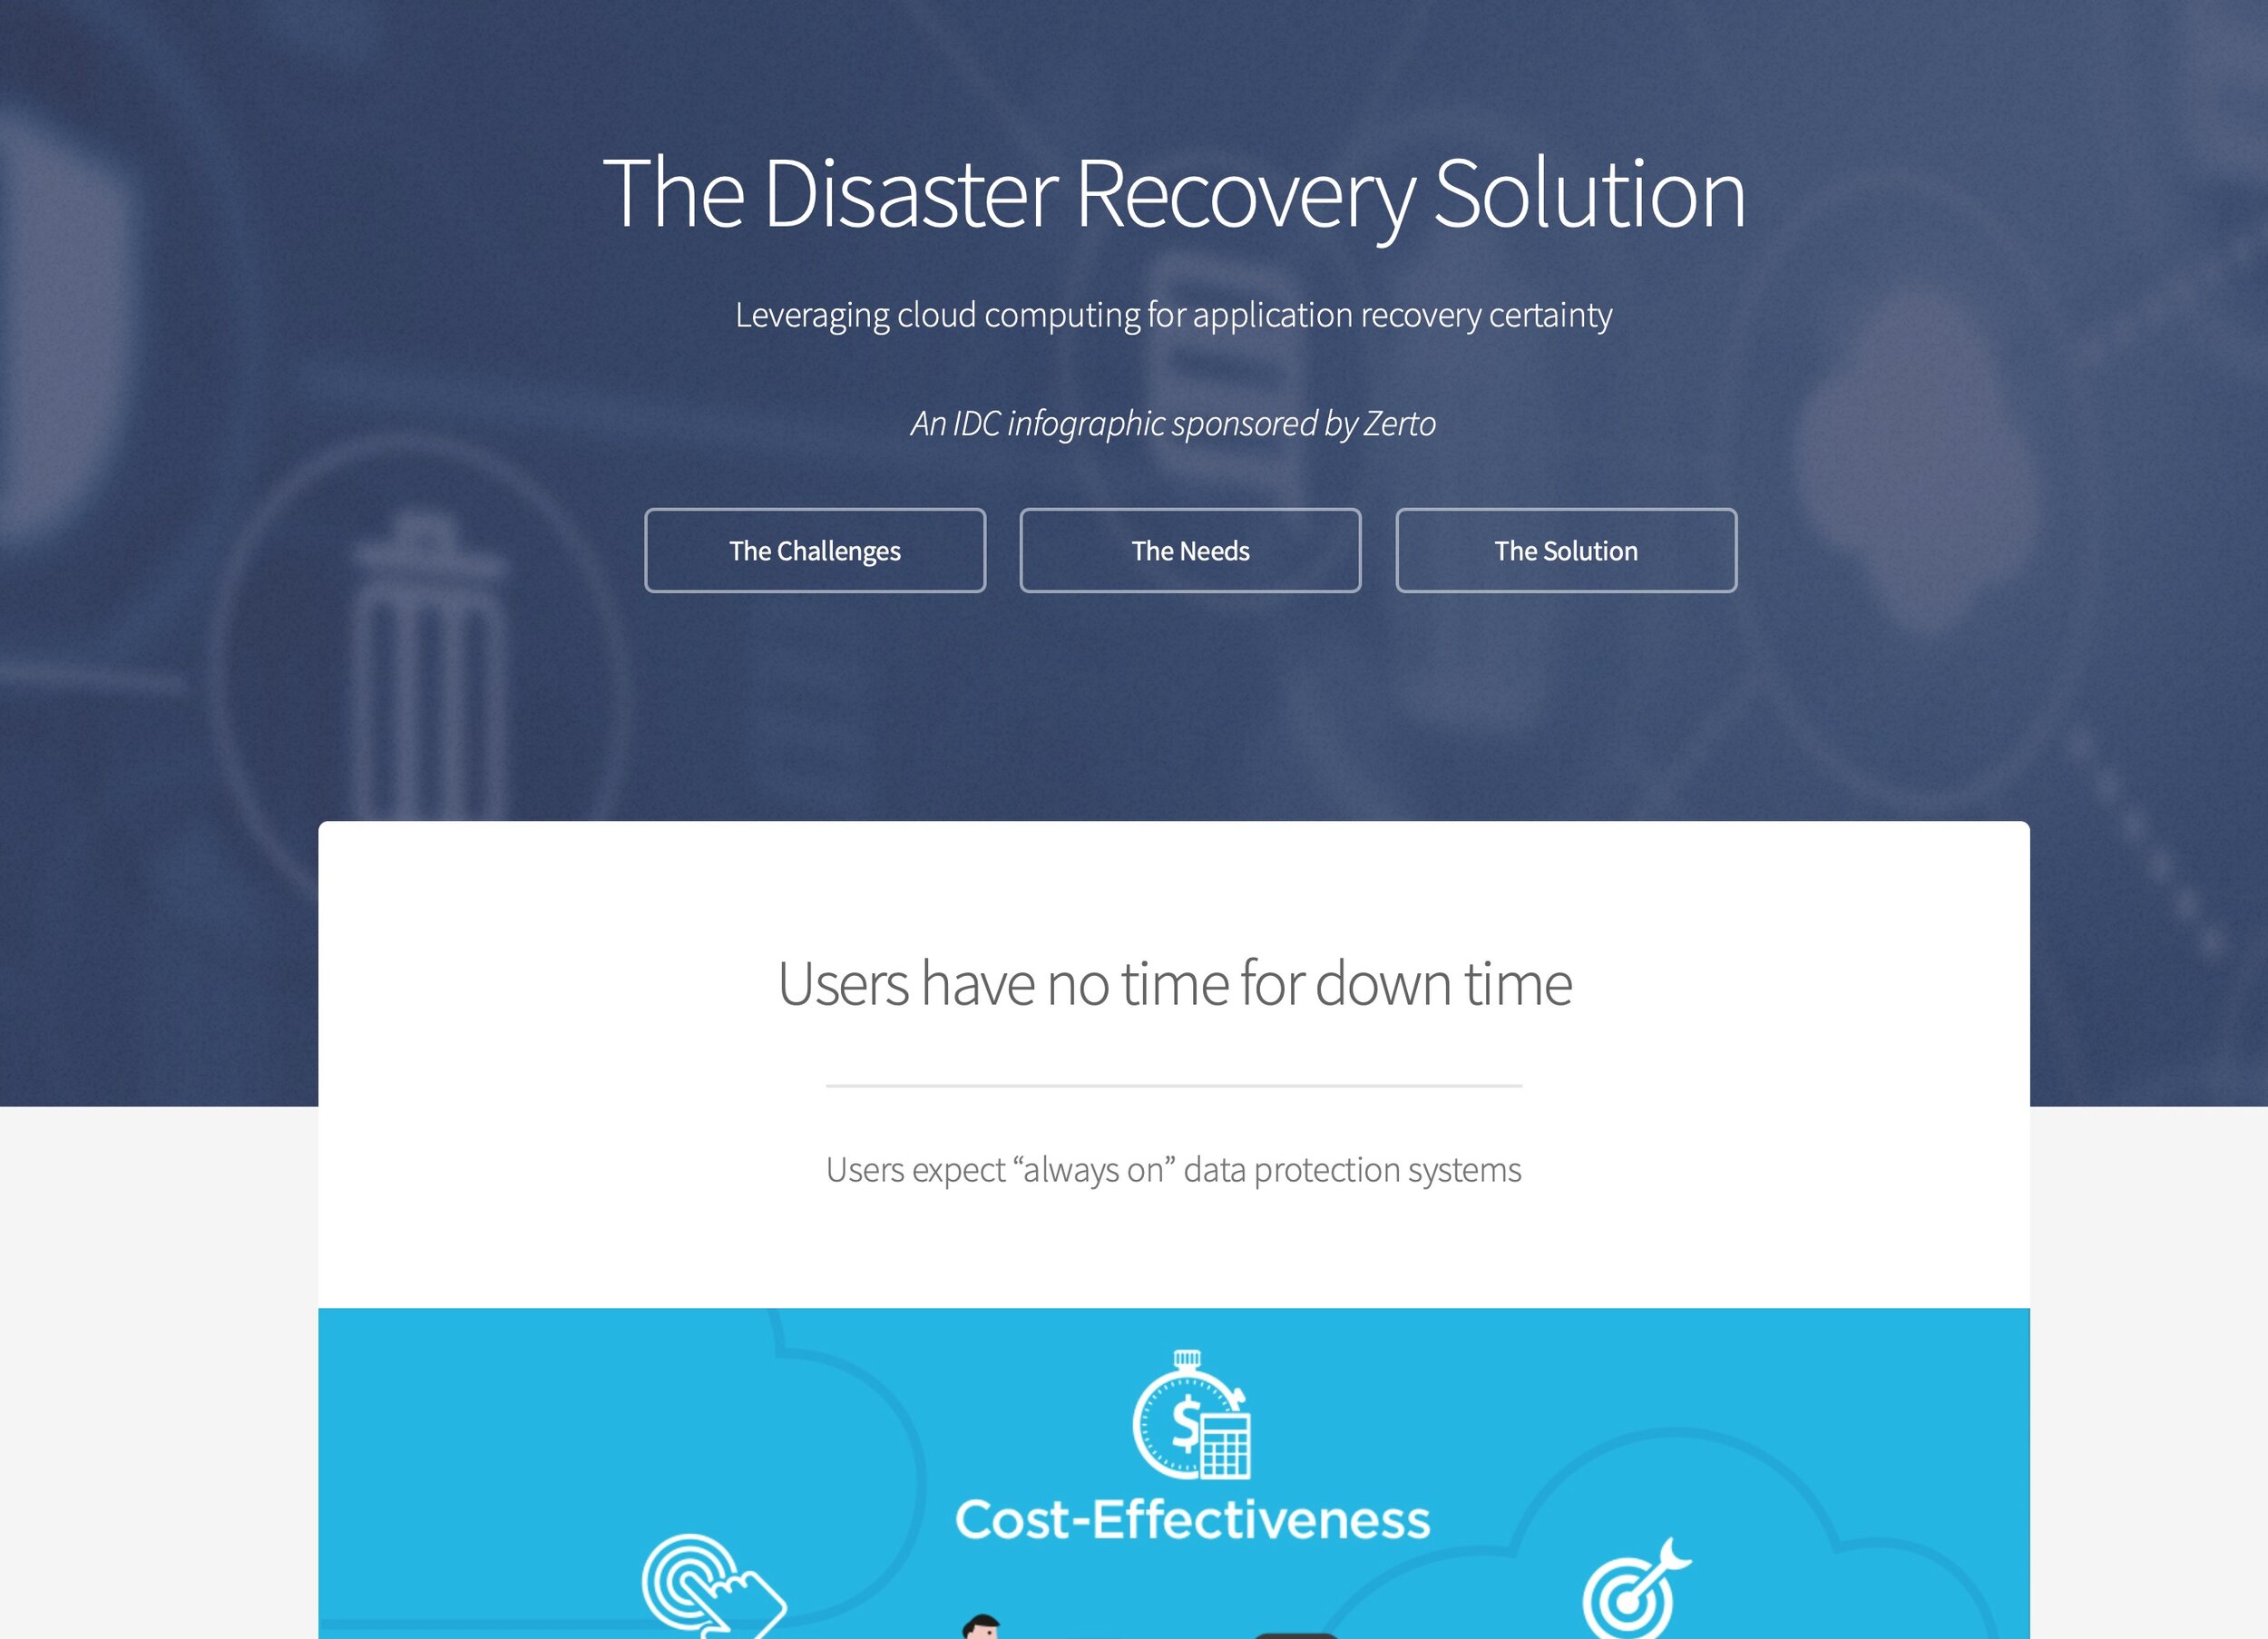
Responsive Infographic Microsite
Disaster Recovery Solution
More extensive web page-based infographic experience. Like creating an online site experience in leu of an infographic…

Animated Infographic
Supply Chain Planning
Converting a static infographic to an animated online version—you end up with both!

Infographic Website—old school basic html
Blueprint for Success
Online infographic, basic html, non-responsive, static
Pricing Infographics

There are wide ranges of prices with infographics, depending on the (1) Type of infographic, (2) The Size of the project, (3) Complexity involved (interactive, vs static), and (4) Budget which affects the value, type, and features…
Here’s a general infographic price curve to show you a general range for infographic pricing depending on options.
Simple, practical, and inspired creative solutions. Free consulting. Free advice. Free first project for qualifiers. Creative strategies and solutions—made easy.
Get creative. http://www.mitchellcreativegroup.com, todd@mitchellcreativegroup.com, (508)494-8182.
© Copyright Todd Mitchell, Mitchell Creative Group, LLC